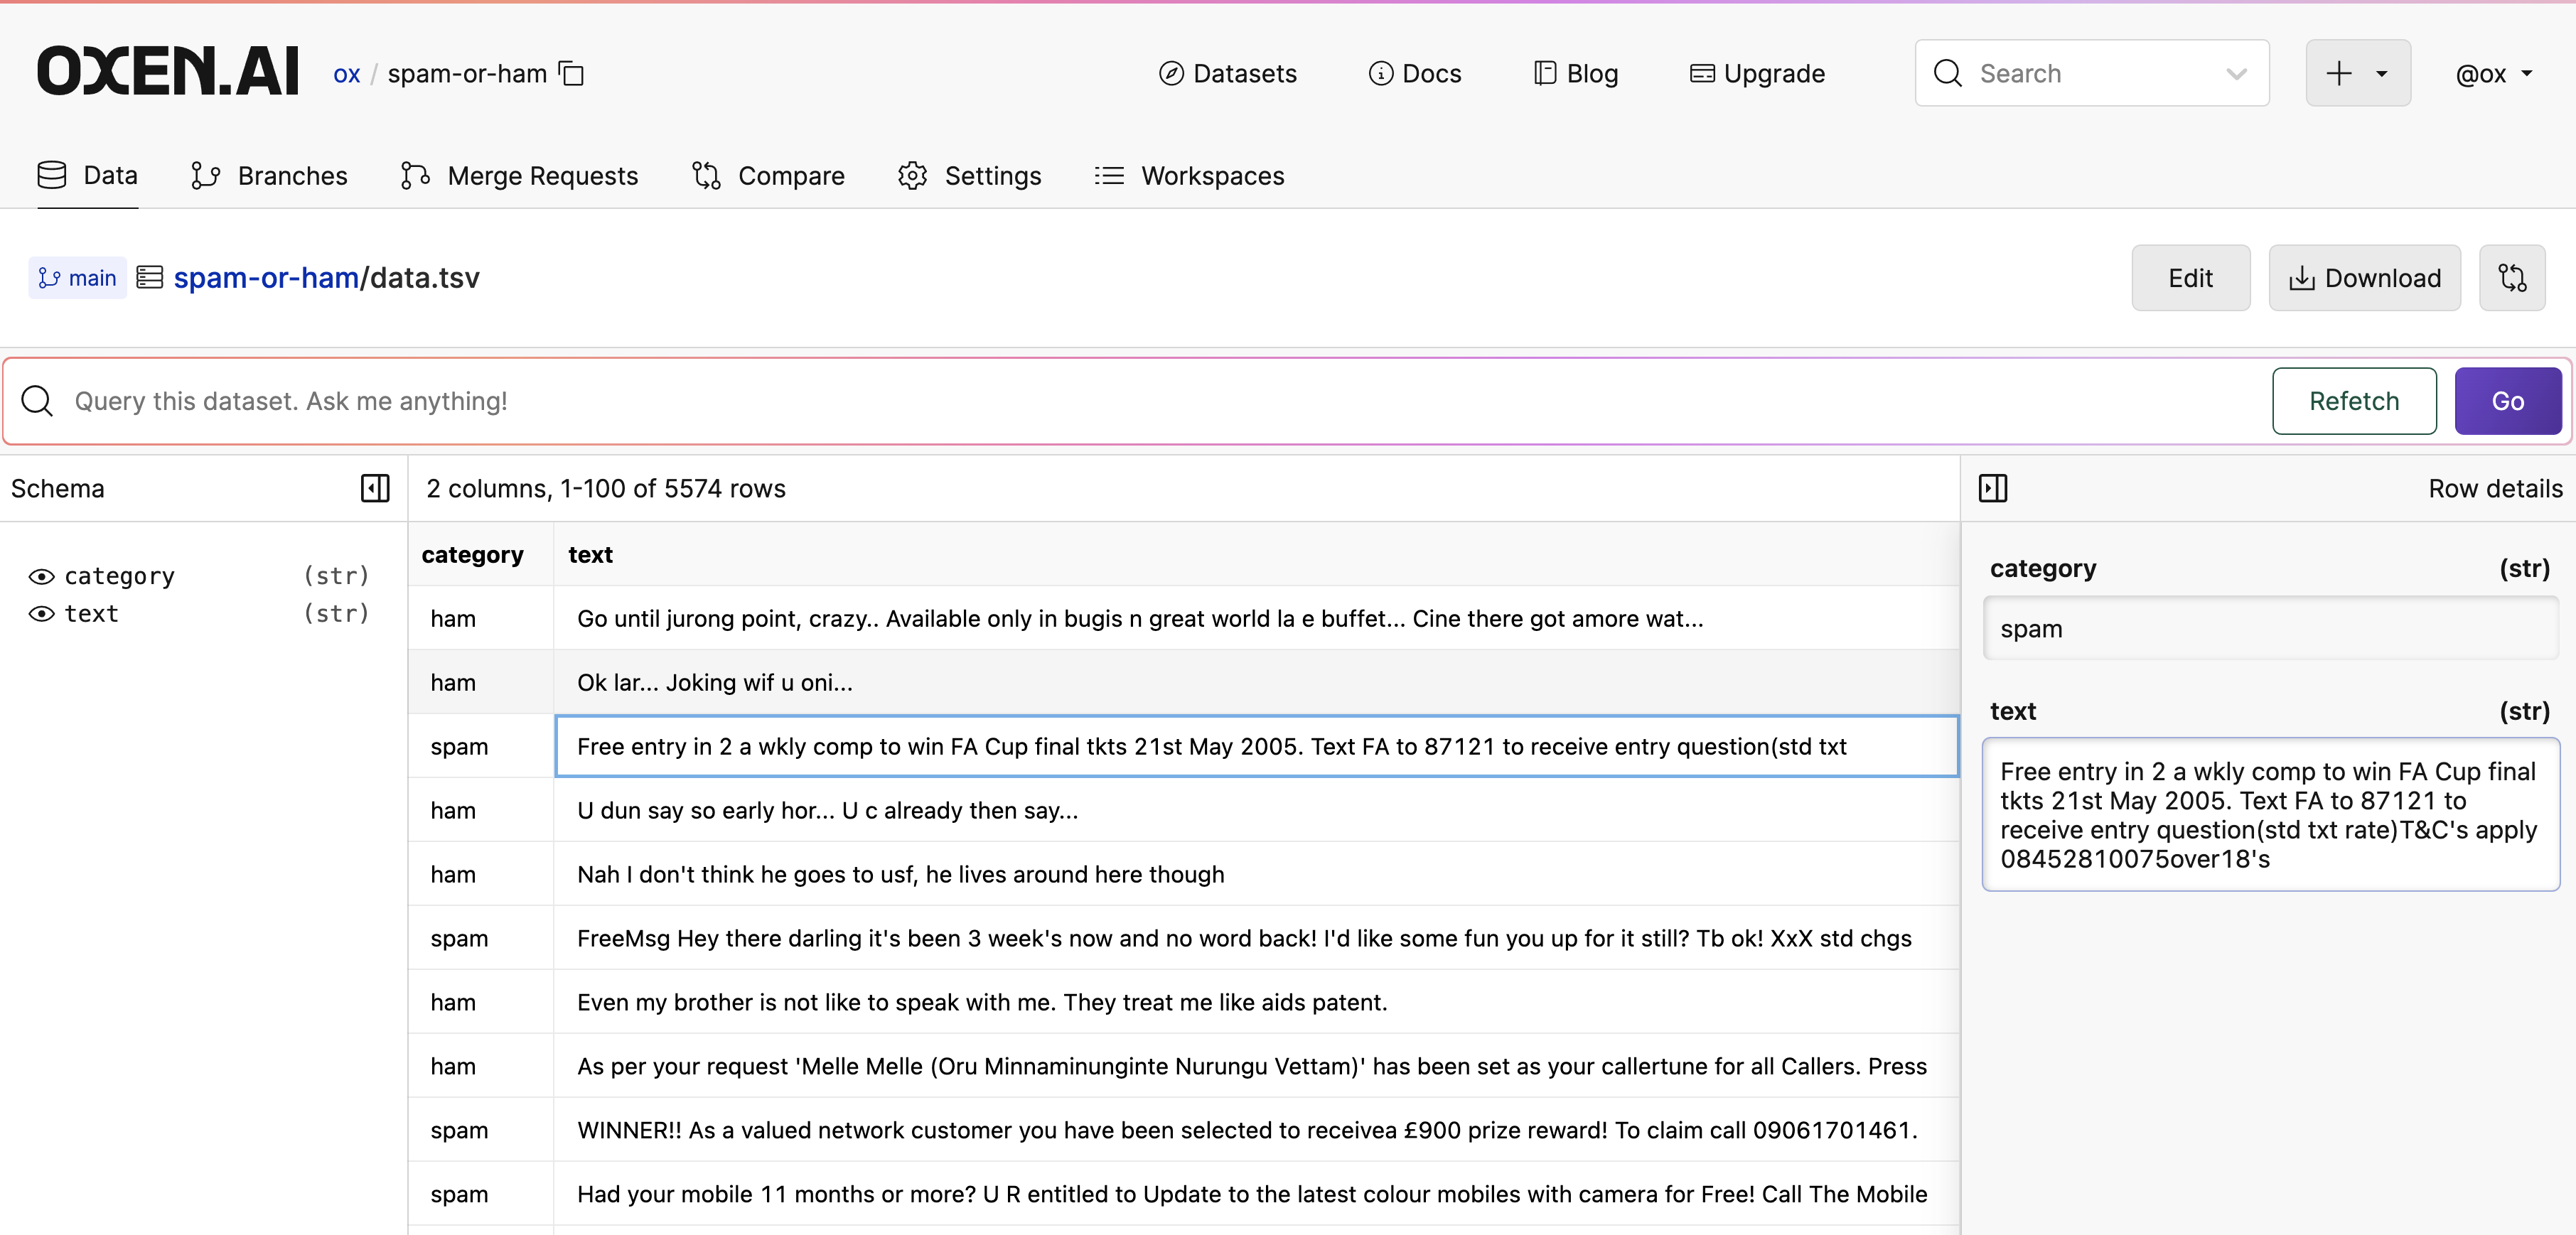
Whether it is csv, parquet, or line delimited json, it is useful to store your training data in data frames that we can filter, aggregate, slice and dice.

To follow along with the examples below feel free to grab to grab the example data from our public CatDogBBox repository.

oxen clone https://hub.oxen.ai/ox/CatDogBBox
cd CatDogBBox

oxen df

Oxen has a convenient df (short for โ€œData Frameโ€) command to deal with tabular data. This example data has 10,000 rows and 6 columns of bounding boxes around cats or dogs. The shape hint at the top of the output can be useful for making sure you are transforming the data correctly.

oxen df annotations/train.csv
shape: (9_000, 6)
+-------------------------+-------+--------+--------+--------+--------+
| file                    โ”† label โ”† min_x  โ”† min_y  โ”† width  โ”† height |
| ---                     โ”† ---   โ”† ---    โ”† ---    โ”† ---    โ”† ---    |
| str                     โ”† str   โ”† f64    โ”† f64    โ”† f64    โ”† f64    |
|-------------------------+-------+--------+--------+--------+--------|
| images/000000128154.jpg โ”† cat   โ”† 0.0    โ”† 19.27  โ”† 130.79 โ”† 129.58 |
| images/000000544590.jpg โ”† cat   โ”† 9.75   โ”† 13.49  โ”† 214.25 โ”† 188.35 |
| images/000000000581.jpg โ”† dog   โ”† 49.37  โ”† 67.79  โ”† 74.29  โ”† 116.08 |
| images/000000236841.jpg โ”† cat   โ”† 115.21 โ”† 96.65  โ”† 93.87  โ”† 42.29  |
| โ€ฆ                       โ”† โ€ฆ     โ”† โ€ฆ      โ”† โ€ฆ      โ”† โ€ฆ      โ”† โ€ฆ      |
| images/000000431980.jpg โ”† dog   โ”† 98.3   โ”† 110.46 โ”† 42.69  โ”† 26.64  |
| images/000000071025.jpg โ”† cat   โ”† 55.33  โ”† 105.45 โ”† 160.15 โ”† 73.57  |
| images/000000518015.jpg โ”† cat   โ”† 43.72  โ”† 4.34   โ”† 72.98  โ”† 129.1  |
| images/000000171435.jpg โ”† dog   โ”† 22.86  โ”† 100.03 โ”† 125.55 โ”† 41.61  |
+-------------------------+-------+--------+--------+--------+--------+

Oxen uses a powerful Data Frame library under the hood, and uses the Apache Arrow data format to provide powerful cross application functionality. A lot of time and effort can be saved by transforming the data on the command line before writing a single line of application specific code or even opening a python repl or Juptyer notebook.

Remote Data Frames

You can also interact with Data Frames that are not downloaded to your local machine. This can be useful for quickly inspecting data on the command line without having to download the data first.

See the Oxen Remote Workspace documentation for more information on how to use remote data frames.

oxen remote df annotations.train.csv

Useful Commands

There are many ways you might want to view, transform, and filter your data on the command line before committing to the version of the dataset.

To quickly see all the options on the df command you can run oxen df --help.

Output Data Formats

The --output option is handy for quickly transforming data files between data formats on disk. Some formats like parquet and arrow are more efficient for data different tasks, but are not human readable like tsv or csv. Data format is always a trade off youโ€™ll have to decide on for your application.

Oxen currently supports these file extensions: csv, tsv, parquet, arrow, json, jsonl.

oxen df annotations/train.csv -o annotations/train.parquet
shape: (9_000, 6)
+-------------------------+-------+--------+--------+--------+--------+
| file                    โ”† label โ”† min_x  โ”† min_y  โ”† width  โ”† height |
| ---                     โ”† ---   โ”† ---    โ”† ---    โ”† ---    โ”† ---    |
| str                     โ”† str   โ”† f64    โ”† f64    โ”† f64    โ”† f64    |
|-------------------------+-------+--------+--------+--------+--------|
| images/000000128154.jpg โ”† cat   โ”† 0.0    โ”† 19.27  โ”† 130.79 โ”† 129.58 |
| images/000000544590.jpg โ”† cat   โ”† 9.75   โ”† 13.49  โ”† 214.25 โ”† 188.35 |
| images/000000000581.jpg โ”† dog   โ”† 49.37  โ”† 67.79  โ”† 74.29  โ”† 116.08 |
| images/000000236841.jpg โ”† cat   โ”† 115.21 โ”† 96.65  โ”† 93.87  โ”† 42.29  |
| โ€ฆ                       โ”† โ€ฆ     โ”† โ€ฆ      โ”† โ€ฆ      โ”† โ€ฆ      โ”† โ€ฆ      |
| images/000000431980.jpg โ”† dog   โ”† 98.3   โ”† 110.46 โ”† 42.69  โ”† 26.64  |
| images/000000071025.jpg โ”† cat   โ”† 55.33  โ”† 105.45 โ”† 160.15 โ”† 73.57  |
| images/000000518015.jpg โ”† cat   โ”† 43.72  โ”† 4.34   โ”† 72.98  โ”† 129.1  |
| images/000000171435.jpg โ”† dog   โ”† 22.86  โ”† 100.03 โ”† 125.55 โ”† 41.61  |
+-------------------------+-------+--------+--------+--------+--------+

Writing "annotations/train.parquet"

View Schema

Oxen automatically detects and versions the schema of your data frame. See the schema docs for more information on the power of Oxen schemas.

To view a data frameโ€™s schema in full, you can use the --schema flag to display the full schema of this data frame.

oxen df annotations/train.csv --schema
+--------+-------+
| column | dtype |
+----------------+
| file   | str   |
|--------+-------|
| label  | str   |
|--------+-------|
| min_x  | f64   |
|--------+-------|
| min_y  | f64   |
|--------+-------|
| width  | f64   |
|--------+-------|
| height | f64   |
+--------+-------+

Slice

Say you want to take a subset of the datafile and save it in another data file. You can do this with the --slice option. This can be handy when creating train, test, and validation sets. The two numbers represent the start and end indices you want to slice into.

oxen df annotations/train.csv --slice '0..8000' -o annotations/train.parquet
shape: (8_000, 6)
+-------------------------+-------+--------+--------+--------+--------+
| file                    โ”† label โ”† min_x  โ”† min_y  โ”† width  โ”† height |
| ---                     โ”† ---   โ”† ---    โ”† ---    โ”† ---    โ”† ---    |
| str                     โ”† str   โ”† f64    โ”† f64    โ”† f64    โ”† f64    |
+-------------------------+-------+--------+--------+--------+--------+
| images/000000128154.jpg โ”† cat   โ”† 0.0    โ”† 19.27  โ”† 130.79 โ”† 129.58 |
| images/000000544590.jpg โ”† cat   โ”† 9.75   โ”† 13.49  โ”† 214.25 โ”† 188.35 |
| images/000000000581.jpg โ”† dog   โ”† 49.37  โ”† 67.79  โ”† 74.29  โ”† 116.08 |
| images/000000236841.jpg โ”† cat   โ”† 115.21 โ”† 96.65  โ”† 93.87  โ”† 42.29  |
| โ€ฆ                       โ”† โ€ฆ     โ”† โ€ฆ      โ”† โ€ฆ      โ”† โ€ฆ      โ”† โ€ฆ      |
| images/000000055645.jpg โ”† cat   โ”† 8.67   โ”† 122.36 โ”† 60.22  โ”† 99.24  |
| images/000000094271.jpg โ”† dog   โ”† 47.6   โ”† 115.26 โ”† 111.57 โ”† 102.27 |
| images/000000041257.jpg โ”† cat   โ”† 6.81   โ”† 117.29 โ”† 207.06 โ”† 86.08  |
| images/000000321014.jpg โ”† cat   โ”† 51.86  โ”† 61.18  โ”† 166.26 โ”† 63.11  |
+-------------------------+-------+--------+--------+--------+--------+
Writing "annotations/train.parquet"

Randomize

Often you will want to randomize data before splitting into train and test sets, or even just to peek at different data values.

oxen df annotations/train.csv --randomize
shape: (9_000, 6)
+-------------------------+-------+--------+--------+--------+--------+
| file                    โ”† label โ”† min_x  โ”† min_y  โ”† width  โ”† height |
| ---                     โ”† ---   โ”† ---    โ”† ---    โ”† ---    โ”† ---    |
| str                     โ”† str   โ”† f64    โ”† f64    โ”† f64    โ”† f64    |
+-------------------------+-------+--------+--------+--------+--------+
| images/000000124002.jpg โ”† cat   โ”† 82.92  โ”† 8.31   โ”† 108.31 โ”† 158.48 |
| images/000000207597.jpg โ”† dog   โ”† 75.64  โ”† 3.65   โ”† 125.47 โ”† 218.19 |
| images/000000113810.jpg โ”† cat   โ”† 104.34 โ”† 44.65  โ”† 119.66 โ”† 159.42 |
| images/000000340160.jpg โ”† dog   โ”† 79.78  โ”† 89.31  โ”† 127.1  โ”† 103.66 |
| โ€ฆ                       โ”† โ€ฆ     โ”† โ€ฆ      โ”† โ€ฆ      โ”† โ€ฆ      โ”† โ€ฆ      |
| images/000000310573.jpg โ”† dog   โ”† 102.55 โ”† 91.48  โ”† 42.24  โ”† 52.18  |
| images/000000162801.jpg โ”† cat   โ”† 112.96 โ”† 75.05  โ”† 57.38  โ”† 98.19  |
| images/000000544117.jpg โ”† dog   โ”† 108.16 โ”† 124.28 โ”† 11.08  โ”† 64.58  |
| images/000000283210.jpg โ”† dog   โ”† 49.37  โ”† 40.01  โ”† 174.43 โ”† 182.0  |
+-------------------------+-------+--------+--------+--------+--------+

View Specific Columns

Maybe you have many columns, and only need to work with a few. You can specify column names in a comma separated list with --columns.

oxen df annotations/train.csv --columns 'file,label'
shape: (9_000, 2)
+-------------------------+-------+
| file                    โ”† label |
| ---                     โ”† ---   |
| str                     โ”† str   |
+-------------------------+-------+
| images/000000128154.jpg โ”† cat   |
| images/000000544590.jpg โ”† cat   |
| images/000000000581.jpg โ”† dog   |
| images/000000236841.jpg โ”† cat   |
| โ€ฆ                       โ”† โ€ฆ     |
| images/000000431980.jpg โ”† dog   |
| images/000000071025.jpg โ”† cat   |
| images/000000518015.jpg โ”† cat   |
| images/000000171435.jpg โ”† dog   |
+-------------------------+-------+

Filter Rows

Oxen has some powerful filter commands built into the CLI. You can quickly filter data down based on a expression involving a column name, an operation, and a row value.

Supported filter operations: --, !-, >, <, <-, >-

Supported logical operations: &&, ||

Supported row dtypes: str, i32, i64, f32, f64

oxen df annotations/train.csv --filter 'label -- dog && height >- 200'

shape: (219, 6)
+-------------------------+-------+-------+-------+--------+--------+
| file                    โ”† label โ”† min_x โ”† min_y โ”† width  โ”† height |
| ---                     โ”† ---   โ”† ---   โ”† ---   โ”† ---    โ”† ---    |
| str                     โ”† str   โ”† f64   โ”† f64   โ”† f64    โ”† f64    |
+-------------------------+-------+-------+-------+--------+--------+
| images/000000459084.jpg โ”† dog   โ”† 127.8 โ”† 0.0   โ”† 96.2   โ”† 224.0  |
| images/000000146030.jpg โ”† dog   โ”† 67.4  โ”† 9.5   โ”† 156.33 โ”† 210.88 |
| images/000000010248.jpg โ”† dog   โ”† 8.76  โ”† 0.48  โ”† 137.07 โ”† 221.28 |
| images/000000046753.jpg โ”† dog   โ”† 34.26 โ”† 13.12 โ”† 127.59 โ”† 208.62 |
| โ€ฆ                       โ”† โ€ฆ     โ”† โ€ฆ     โ”† โ€ฆ     โ”† โ€ฆ      โ”† โ€ฆ      |
| images/000000127937.jpg โ”† dog   โ”† 99.23 โ”† 2.49  โ”† 124.77 โ”† 219.01 |
| images/000000106621.jpg โ”† dog   โ”† 43.44 โ”† 8.6   โ”† 143.56 โ”† 211.78 |
| images/000000325186.jpg โ”† dog   โ”† 42.18 โ”† 17.64 โ”† 137.42 โ”† 201.01 |
| images/000000216014.jpg โ”† dog   โ”† 3.65  โ”† 7.53  โ”† 167.2  โ”† 213.18 |
+-------------------------+-------+-------+-------+--------+--------+

Concatenate (vstack)

Maybe you have filtered down data, and want to stack the data back into a single frame. The --vstack option takes a variable length list of files you would like to concatenate.

oxen df annotations/train.csv --filter 'label-dog' -o /tmp/dogs.parquet
oxen df annotations/train.csv --filter 'label-cat' -o /tmp/cats.parquet
oxen df /tmp/cats.parquet --vstack /tmp/dogs.parquet -o annotations/data.parquet

Take Indices

Sometimes you have a specific row or set of rows of data you would like to look at. This is where the --take option comes in handy.

oxen df annotations/train.csv --take '1,13,42'
shape: (3, 6)
+-------------------------+-------+-------+-------+--------+--------+
| file                    โ”† label โ”† min_x โ”† min_y โ”† width  โ”† height |
| ---                     โ”† ---   โ”† ---   โ”† ---   โ”† ---    โ”† ---    |
| str                     โ”† str   โ”† f64   โ”† f64   โ”† f64    โ”† f64    |
+-------------------------+-------+-------+-------+--------+--------+
| images/000000544590.jpg โ”† cat   โ”† 9.75  โ”† 13.49 โ”† 214.25 โ”† 188.35 |
| images/000000279829.jpg โ”† cat   โ”† 30.01 โ”† 13.58 โ”† 82.51  โ”† 176.39 |
| images/000000209289.jpg โ”† dog   โ”† 72.75 โ”† 42.06 โ”† 111.52 โ”† 153.09 |
+-------------------------+-------+-------+-------+--------+--------+

Add Column

Your data might not match the schema of a data frame you want to combine with, in this case you may need to add a column to match the schema. You can do this and project default values with --add-col 'col:val:dtype'

oxen df annotations/train.csv --add-col 'is_cute:unknown:str'
shape: (9_000, 7)
+-------------------------+-------+--------+--------+--------+--------+---------+
| file                    โ”† label โ”† min_x  โ”† min_y  โ”† width  โ”† height โ”† is_cute |
| ---                     โ”† ---   โ”† ---    โ”† ---    โ”† ---    โ”† ---    โ”† ---     |
| str                     โ”† str   โ”† f64    โ”† f64    โ”† f64    โ”† f64    โ”† str     |
+-------------------------+-------+--------+--------+--------+--------+---------+
| images/000000128154.jpg โ”† cat   โ”† 0.0    โ”† 19.27  โ”† 130.79 โ”† 129.58 โ”† unknown |
| images/000000544590.jpg โ”† cat   โ”† 9.75   โ”† 13.49  โ”† 214.25 โ”† 188.35 โ”† unknown |
| images/000000000581.jpg โ”† dog   โ”† 49.37  โ”† 67.79  โ”† 74.29  โ”† 116.08 โ”† unknown |
| images/000000236841.jpg โ”† cat   โ”† 115.21 โ”† 96.65  โ”† 93.87  โ”† 42.29  โ”† unknown |
| โ€ฆ                       โ”† โ€ฆ     โ”† โ€ฆ      โ”† โ€ฆ      โ”† โ€ฆ      โ”† โ€ฆ      โ”† โ€ฆ       |
| images/000000431980.jpg โ”† dog   โ”† 98.3   โ”† 110.46 โ”† 42.69  โ”† 26.64  โ”† unknown |
| images/000000071025.jpg โ”† cat   โ”† 55.33  โ”† 105.45 โ”† 160.15 โ”† 73.57  โ”† unknown |
| images/000000518015.jpg โ”† cat   โ”† 43.72  โ”† 4.34   โ”† 72.98  โ”† 129.1  โ”† unknown |
| images/000000171435.jpg โ”† dog   โ”† 22.86  โ”† 100.03 โ”† 125.55 โ”† 41.61  โ”† unknown |
+-------------------------+-------+--------+--------+--------+--------+---------+

Add Row

Sometimes it can be a pain to append data to a data file without writing code to do so. The --add-row option makes it as easy as a comma separated list and automatically parses the data to the correct dtypes.

oxen df annotations/train.csv --add-row 'images/my_cat.jpg,cat,0,0,0,0'
shape: (9_001, 6)
+-------------------------+-------+--------+--------+--------+--------+
| file                    โ”† label โ”† min_x  โ”† min_y  โ”† width  โ”† height |
| ---                     โ”† ---   โ”† ---    โ”† ---    โ”† ---    โ”† ---    |
| str                     โ”† str   โ”† f64    โ”† f64    โ”† f64    โ”† f64    |
+-------------------------+-------+--------+--------+--------+--------+
| images/000000128154.jpg โ”† cat   โ”† 0.0    โ”† 19.27  โ”† 130.79 โ”† 129.58 |
| images/000000544590.jpg โ”† cat   โ”† 9.75   โ”† 13.49  โ”† 214.25 โ”† 188.35 |
| images/000000000581.jpg โ”† dog   โ”† 49.37  โ”† 67.79  โ”† 74.29  โ”† 116.08 |
| images/000000236841.jpg โ”† cat   โ”† 115.21 โ”† 96.65  โ”† 93.87  โ”† 42.29  |
| โ€ฆ                       โ”† โ€ฆ     โ”† โ€ฆ      โ”† โ€ฆ      โ”† โ€ฆ      โ”† โ€ฆ      |
| images/000000071025.jpg โ”† cat   โ”† 55.33  โ”† 105.45 โ”† 160.15 โ”† 73.57  |
| images/000000518015.jpg โ”† cat   โ”† 43.72  โ”† 4.34   โ”† 72.98  โ”† 129.1  |
| images/000000171435.jpg โ”† dog   โ”† 22.86  โ”† 100.03 โ”† 125.55 โ”† 41.61  |
| images/my_cat.jpg       โ”† cat   โ”† 0.0    โ”† 0.0    โ”† 0.0    โ”† 0.0    |
+-------------------------+-------+--------+--------+--------+--------+

Aggregate

Oxen Data Frame aggregations can be helpful to quickly get statistics about your data. You can save these statistics to disk and commit them to track stats about your data over time.

The format for an aggregation query is similar to a lambda function. The inputs to the function are the column name(s) you want to group by. The outputs are functions you want to run over the grouped results.

('col_0') -> (min('col_1'), max('col_2'))

This simple example aggregation query would be if you wanted to find a distribution of labels in a dataset.

For example in our cats vs dogs dataset you can group by the 'label' column, and then run the count() function value over all the values in the 'file' column.

oxen df annotations/train.csv -a "('label') -> (count('file'))"
shape: (2, 2)
+-------+---------------+
| label โ”† count('file') |
| ---   โ”† ---           |
| str   โ”† u32           |
+-------+---------------+
| cat   โ”† 4140          |
| dog   โ”† 4860          |
+-------+---------------+

You can specify multiple functions in the output. For example if you wanted the unique file count as well as the raw count you can add the n_unique() function.

oxen df annotations/train.csv -a "('label') -> (count('file'), n_unique('file'))"
shape: (2, 3)
+-------+---------------+------------------+
| label โ”† count('file') โ”† n_unique('file') |
| ---   โ”† ---           โ”† ---              |
| str   โ”† u32           โ”† u32              |
+-------+---------------+------------------+
| dog   โ”† 4860          โ”† 3798             |
| cat   โ”† 4140          โ”† 3525             |
+-------+---------------+------------------+

Here is a list of supported output aggregation functions:

  • list aggregate column values into a list
  • count count the aggregated values
  • n_unique unique count of the aggregated values
  • min minimum value of the group
  • max maximum value of the group
  • arg_min index of minimum value in the group
  • arg_max index of maximum value in the group
  • mean mean value of the group
  • median median value of the group
  • std standard deviation of the group
  • var variance of the group
  • first first value of the group
  • last last value in the group
  • head first 5 values of group
  • tail last 5 values of the group

Unique

Oxen can efficiently compute all the unique values given a column name, or comma separated list of column names.

oxen df annotations/train.csv --unique "file"
oxen df annotations/train.csv -u "file,label"

Sort

Sorting can be achieved with the sort flag. For example you may want to find the largest bounding boxes by sorting on the height column.

oxen df annotations/train.csv --sort "height"
shape: (9_000, 6)
+-------------------------+-------+--------+--------+--------+--------+
| file                    โ”† label โ”† min_x  โ”† min_y  โ”† width  โ”† height |
| ---                     โ”† ---   โ”† ---    โ”† ---    โ”† ---    โ”† ---    |
| str                     โ”† str   โ”† f64    โ”† f64    โ”† f64    โ”† f64    |
+-------------------------+-------+--------+--------+--------+--------+
| images/000000580919.jpg โ”† dog   โ”† 61.28  โ”† 88.31  โ”† 2.71   โ”† 1.83   |
| images/000000577310.jpg โ”† dog   โ”† 132.25 โ”† 193.86 โ”† 3.28   โ”† 1.95   |
| images/000000393384.jpg โ”† dog   โ”† 138.85 โ”† 89.89  โ”† 1.25   โ”† 2.11   |
| images/000000477398.jpg โ”† dog   โ”† 185.11 โ”† 195.93 โ”† 2.51   โ”† 2.6    |
| โ€ฆ                       โ”† โ€ฆ     โ”† โ€ฆ      โ”† โ€ฆ      โ”† โ€ฆ      โ”† โ€ฆ      |
| images/000000069205.jpg โ”† dog   โ”† 0.0    โ”† 0.0    โ”† 224.0  โ”† 224.0  |
| images/000000554737.jpg โ”† cat   โ”† 0.0    โ”† 0.0    โ”† 224.0  โ”† 224.0  |
| images/000000213819.jpg โ”† cat   โ”† 8.32   โ”† 0.0    โ”† 207.77 โ”† 224.0  |
| images/000000397212.jpg โ”† cat   โ”† 0.36   โ”† 0.0    โ”† 115.5  โ”† 224.0  |
+-------------------------+-------+--------+--------+--------+--------+

Sort is also useful in the context of aggregations. When aggregating up statistics they do not come back in a guaranteed order. If you want to see which files have the most labels, you can group the output if an aggregation count() function.

oxen df annotations/train.csv -a "('file') -> (list('label'), count('label'))" --sort "count('label')"
shape: (7_128, 3)
+-------------------------+-------------------------+----------------+
| file                    โ”† list('label')           โ”† count('label') |
| ---                     โ”† ---                     โ”† ---            |
| str                     โ”† list[str]               โ”† u32            |
+-------------------------+-------------------------+----------------+
| images/000000197809.jpg โ”† ["cat"]                 โ”† 1              |
| images/000000558132.jpg โ”† ["dog"]                 โ”† 1              |
| images/000000479403.jpg โ”† ["cat"]                 โ”† 1              |
| images/000000104262.jpg โ”† ["cat"]                 โ”† 1              |
| โ€ฆ                       โ”† โ€ฆ                       โ”† โ€ฆ              |
| images/000000113762.jpg โ”† ["cat", "cat", โ€ฆ "cat"] โ”† 14             |
| images/000000244933.jpg โ”† ["cat", "cat", โ€ฆ "cat"] โ”† 17             |
| images/000000016950.jpg โ”† ["dog", "dog", โ€ฆ "dog"] โ”† 19             |
| images/000000315555.jpg โ”† ["dog", "dog", โ€ฆ "dog"] โ”† 19             |
+-------------------------+-------------------------+----------------+

Reverse

You can also reverse the order of a data table. By default --sort sorts in ascending order, but can be reversed with the --reverse flag.

oxen df annotations/train.csv -a "('file') -> (count('label'))" --sort "count('label')" --reverse
shape: (7_128, 2)
+-------------------------+----------------+
| file                    โ”† count('label') |
| ---                     โ”† ---            |
| str                     โ”† u32            |
+-------------------------+----------------+
| images/000000315555.jpg โ”† 19             |
| images/000000016950.jpg โ”† 19             |
| images/000000244933.jpg โ”† 17             |
| images/000000113762.jpg โ”† 14             |
| โ€ฆ                       โ”† โ€ฆ              |
| images/000000026942.jpg โ”† 1              |
| images/000000491845.jpg โ”† 1              |
| images/000000536154.jpg โ”† 1              |
| images/000000559557.jpg โ”† 1              |
+-------------------------+----------------+